How Tradingview can help you Analyze markets without headaches
Follow us on Tradingview →
Key Takeaways
- TradingView is a powerful charting and analysis platform designed for traders and investors of all experience levels, offering tools for diverse asset classes like stocks, forex, commodities, and cryptocurrency.
- The platform provides advanced features such as customizable chart templates and a large selection of indicators. It offers features for different time frames, enabling it to work with short-, mid- and long-term trading strategies.
- Users can also share insights and follow other traders through its social networking features. This promotes transparency and inspires innovative sharing of ideas throughout the community.
- Paid Options The premium options give you more features, such as more indicators, more advanced tools and an ad-free experience.
- New traders and investors will appreciate TradingView’s user-friendly design and learning resources. At the same time, advanced users love the platform’s complex analysis capabilities and professional-grade tools.
- It’s continually available and easily accessible on mobile and desktop platforms. Combined with its intuitive user interface, it’s the perfect way to trade conveniently, even while you’re out and about.
TradingView is an online platform designed for traders and investors to analyze financial markets, develop strategies, and track real-time data. It offers powerful technical analysis charting tools and a wide range of customizable technical indicators. You’ll have access to many asset classes such as stocks, forex, crypto, and commodities.
Its intuitive cloud-based interface means you can access your work from any device. This makes it a powerful tool for both newbies and advanced users. Social features including idea sharing and chat keep you plugged into a vibrant global trading community.
You’ll find valuable insider's tips and learn from more experienced traders. The platform offers paper trading, allowing you to test strategies risk-free. TradingView is an all-in-one tool that marries in-depth market analysis, robust strategy development, and community engagement all under one roof.
What is TradingView?
Purpose of the Platform
TradingView is a powerful social community, technical analysis, and trading platform that offers an unparalleled trading experience for investors and traders alike. This collaborative social network allows users to write and publish their trading ideas and financial analysis, fostering a strong community. You can analyze data using various chart styles, including candlestick, Renko, Point and Figure, and Kagi, which enhances your understanding of market conditions.
The platform supports every trader, from short-term scalpers to long-term investors, with advanced features such as multi-chart setups and synchronized chart replay. These tools provide versatility for intricate analysis and allow you to refine your strategies effectively. Additionally, the simulated trading feature enables you to learn from historical data, making it a valuable resource for developing precise trading decisions.
By replaying historical market trends step-by-step, you can enhance your trading activity and develop potential trading ideas. TradingView's capabilities are designed to cater to different trading needs, ensuring that users can automate strategies and make informed decisions based on comprehensive market analysis.
Who Can Use TradingView?
TradingView is open and free for anyone who is interested in financial markets. For the novice, it’s very user-friendly to get started with basic charting. For advanced traders, the platform gives you the ability to create custom strategies precisely to your specifications.
Its global user base of more than 30 million includes everyone from retail hobbyist traders to institutional analysts. The social aspect of the platform is powerful, enabling performance reports, strategies, or even drawing tools to be shared, enabling collaboration and learning.
For example, you can follow top-performing traders to learn from their strategies or publish your own strategies to the community to attract followers yourself.
Benefits of Using TradingView
Among its powerful features, TradingView helps make informed decisions. It provides robust strategy performance reports and extensive customization options, allowing you to customize strategies to achieve certain goals.
The platform’s broad financial data universe allows you to make intra-market and inter-category comparisons that can help you identify macro trends across sectors. Equipped with an innovative mobile app, you can stay in touch on-the-go, whether monitoring live charts or analyzing historical results.
Consistently ranked among the top 130 websites in the world, TradingView’s up-time and active community of millions of traders provides a powerful resource for market participants.
Features of the TradingView Platform
Charting Tools and Options
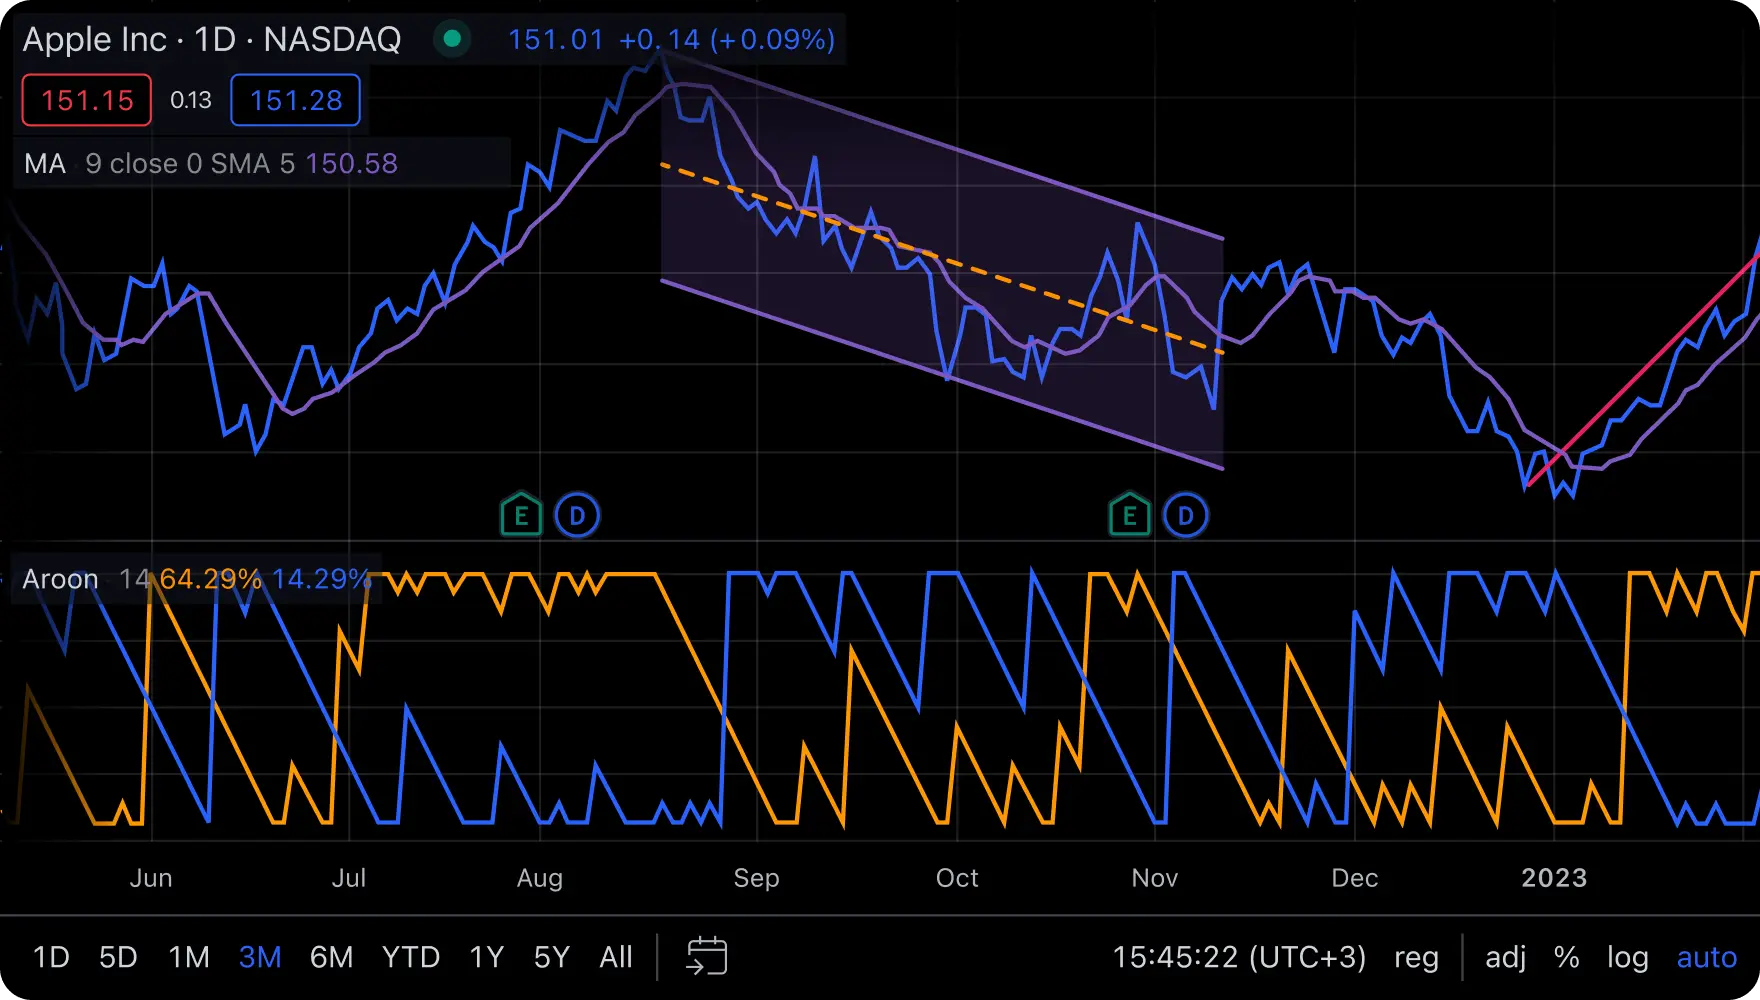
TradingView’s charting tools are truly on another level, creating a unique, highly flexible user-friendly experience. You can easily draw trend lines, apply Fibonacci retracements, or plot support and resistance levels. These are the tools you need to analyze price movements and take advantage of trading opportunities.
So if you’re anticipating a breakout on a stock you’re watching, the platform provides tools to help you identify important levels to make more informed decisions. From zooming in and panning around, to switching to a candle view or bar chart, TradingView’s interactive charts give you total control over your technical analysis.
It’s these unique features that create the best charting platform found anywhere, and why professional traders are raving about TradingView.
Indicators and Analysis Tools
No matter if you’re a beginner or a pro, TradingView is a platform for everyone, with over 100 built-in technical indicators. Classic tools such as Moving Averages, RSI, and MACD are literally a click away.
If you’re a little more advanced, its Pine Script programming lets you build your own indicators and strategies. For example, you could create a custom alert for when a certain market condition exists, which means you only need to check your alerts and avoid unnecessary research.
This level of flexibility gives you the power to make your analysis as accurate and tailored as possible.
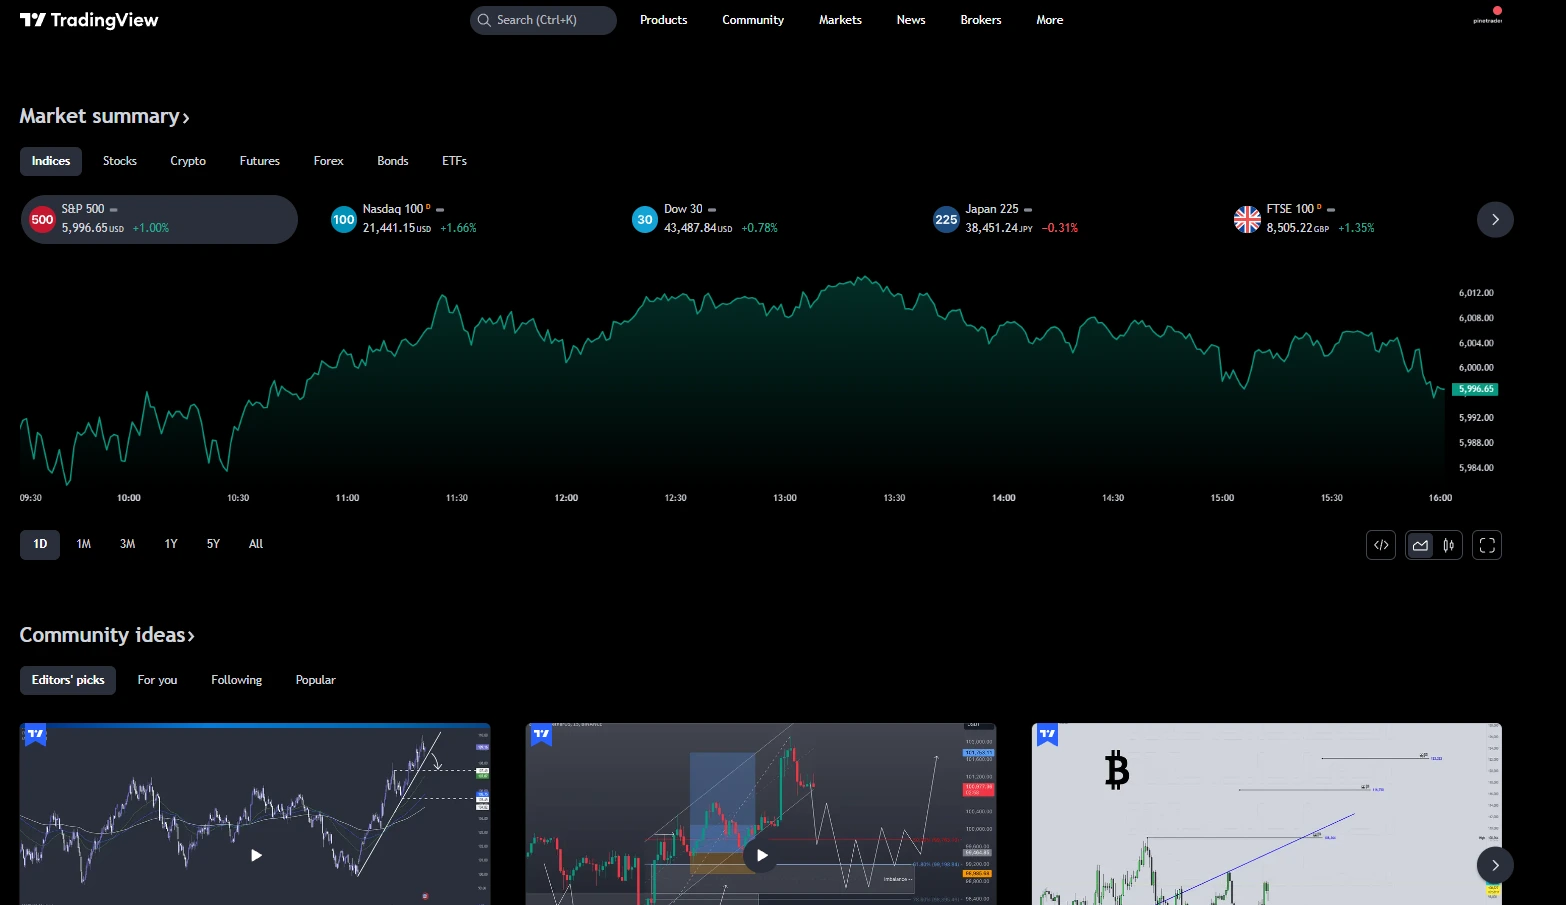
Symbol Search and Comparison
Conducting research is super easy on TradingView thanks to their robust symbol comparison and search capabilities. You can research assets on over 70 global stock exchanges such as stocks, forex, and crypto.
The comparison tool allows you to compare several symbols at once, side-by-side, making it easy to identify trends or correlations at a glance. For instance, you might analyze the relationship between the S&P 500 and Bitcoin to see how traditional and crypto markets affect each other.
This feature helps to cut down your entire research process.
Time Frames and Chart Types
Whether you’re a quick-fire day trader or a careful value investor, the platform’s various timeframes, from one second to monthly charts, have you covered. Pair it with all of our other supported chart types, including candlestick, line or Heikin-Ashi.
This results in a configuration that personalizes and custom fits to your unique trading demands. For instance, day traders might prefer one-minute candlestick charts, while swing traders might use daily Heikin-Ashi charts to identify trends.
All of these options make it a great versatile platform fit for any trading strategy.
Customizable Chart Templates
TradingView is highly customizable. You can save chart templates, complete with your preferred indicators, settings and overall design. Whether you’re tracking forex pairs or commodity prices, customizable templates let you work more efficiently with a few clicks.
If you trade both gold and oil, you could set up different templates specific to each market. This feature is invaluable in keeping you organized and efficient while executing trades.
How to Use TradingView
1. Creating a Profile
In order to use TradingView to it’s full potential, you’ll first want to set up a profile. This process is simple: sign up using your email address or connect through platforms like Google or Facebook.
Once registered, your profile is your trading command center. It helps you monitor your chart layouts, saved concepts, and even interact with the TradingView community.
Profiles give you the ability to customize your experience. You can track other traders and post your own insights publicly using the “Trading Ideas” feature. Through collaboration, you can walk away with new ideas and approaches to strengthen your game plan.
2. Setting Up Chart Templates
Pre-loading chart templates allows you to not only save time, but stay organized. To use the chart as an example, click “Products” in the top navigation bar and choose “Supercharts.
From there, you’ll have full control to customize everything, from chart types to color schemes and layout preferences. For example, you might want to create a candlestick chart with Bollinger Bands and RSI to do some technical analysis on it.
Templates are quick to save and load, allowing for consistent setups no matter which day or week you’re trading on.
3. Searching for Symbols
Finding symbols to search for is pretty easy. Use the search bar at the top to search for any stock, forex pair, commodity or cryptocurrency.
With support for data from markets across the globe, TradingView is a powerful solution for traders of all backgrounds. If you want to follow Tesla (TSLA) or EUR/USD, just enter the name or ticker.
Your chart will appear immediately!
4. Adjusting Time Frames
As with everything in the market, time frames are very important when trying to understand the trend. One of the great things about TradingView is you can easily toggle between time frames from one second to one year.
The toolbar menu at the top provides a convenient drop-down menu to make the adjustments quickly. Day traders love the shorter time frames, like the 1-minute or 5-minute candles.
In sharp contrast, long-term investors typically like to look at charts on a weekly or monthly time frame.
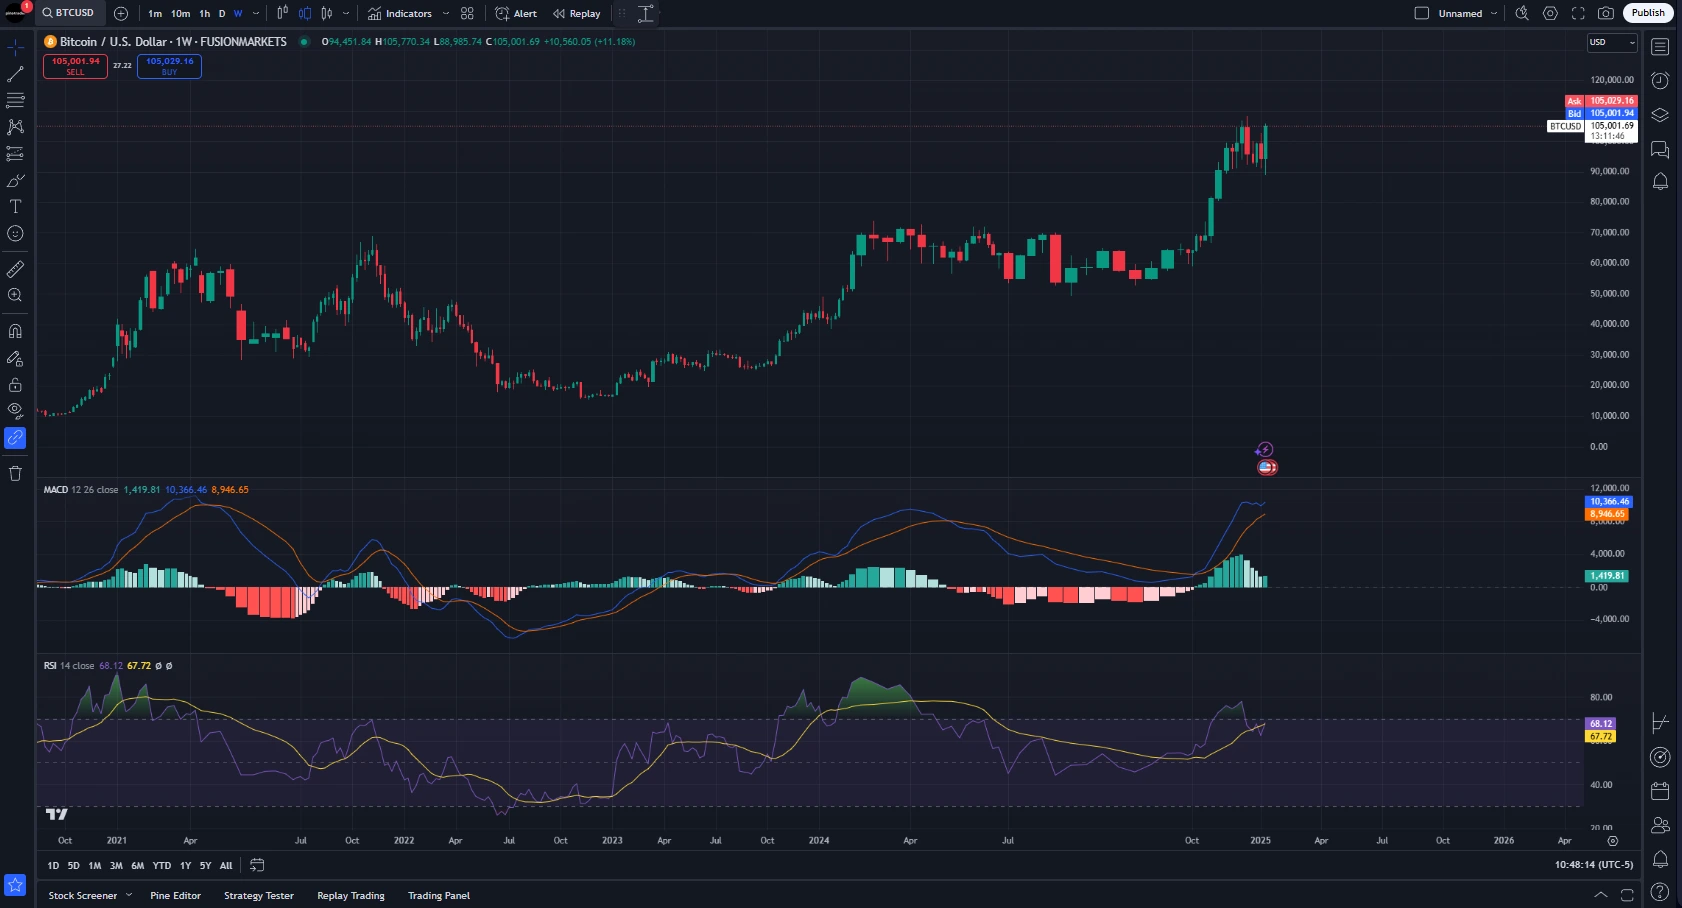
5. Applying Indicators and Overlays
With more than 100 built-in indicators like Moving Averages, MACD and candlestick pattern recognition, TradingView makes it easy to analyze any market.
Setting these is as simple as picking them out from the drop-down menu in the top toolbar. For instance, you can add RSI on top to track momentum or Bollinger Bands to detect volatility.
You’ll get free access to more than 100,000 community-created indicators. These tools help you trade the way you want to trade!
6. Setting Price Alerts
Price alerts are a godsend when you’re just trying to keep tabs on a moving market. On the TradingView chart, you can right-click to create your alerts.
Next, click “Add Alert” and set your conditions, like price levels or indicator triggers. For instance, you may wish to set an alert when Bitcoin (BTC) goes above $30,000.
You can get these alerts via email, push notification, or right on the platform. With that, you can always be in the loop and never miss out!
Exploring Advanced Tools
Waves and Cycle Analysis
TradingView offers powerful tools built specifically for wave and cycle analysis. These tools let you accurately identify trends and forecast market movements. Analyze every price movement like never before with a huge library of more than 400 prebuilt indicators and drawing tools.
Explore the data, and start crunching numbers like an expert! You can take advantage of advanced tools such as Fibonacci retracements and Elliott Wave indicators. They allow you to study past price trends and forecast where the market will go next.
With a Pine Script library of over 100,000 community-built indicators, this capability is only amplified. This level of customization gives you the freedom to conduct your analysis the way you trade. With this edge, you’re able to more keenly spot more profitable opportunities.
Range and Measurement Features
The platform’s breadth and measurement tools provide you the detail and accuracy necessary to execute complex trading strategies. You can analyze price ranges, travel time and bidirectional trends in a matter of clicks.
Use the measuring tool to calculate percentage increases or decreases as well as price differences between two locations. This is incredibly helpful in monitoring your performance and setting your stop-loss levels.
With TradingView’s backtesting feature, you can backtest these strategies on historical data. This enables you to test different strategies and iterate on your approach before deploying them in live markets. This makes sure that your strategies can be cost-efficient and outcome-effective.
Social Networking for Traders
TradingView isn’t only a powerful set of tools—it’s an amazing community of traders. The platform immerses you in a global community of traders, empowering you with collective wisdom through shared strategies, chart ideas and open discussions.
Educational resources such as tutorials and webinars are widely available, keeping you informed and honing your skills. Couple that with a creative, collaborative environment and you’re never trading alone, gaining new perspectives from your peers around the globe.
Subscription Plans and Costs
Free vs Paid Plans
TradingView’s Basic plan is a great introductory option for new traders or anyone trying out the platform. It still provides you with the necessary tools, such as 2 indicators per chart, 5 price alerts, and 1 technical alert, making it a valuable resource for retail traders. It’s free and ad-supported, so it’s a low-risk way to test the waters of your trading experience.
If you’re serious about your trading, the paid plans offer a much wider toolkit tailored to different trading needs. The Plus, Premium, Expert, and Ultimate plans cater to more advanced traders, allowing for strategy backtesting and access to potential trading ideas. For example, the Plus plan adds features like 10 indicators per chart and additional alerts.
Premium users enjoy advanced features like ad-free paper trading, which enhances their trading outcomes. The Ultimate plan is designed specifically for professional traders, ensuring that they have access to the most comprehensive tools available, so you’re never limited in your trading approach.
Features in Premium Plans
This is where TradingView really starts to shine with their premium plans. You get access to more advanced charts, custom time ranges, and more rapid data refreshes. For instance, with the Premium plan, you get unlimited chart layouts and advanced alert conditions.
Higher plans, such as Expert and Ultimate, include exclusive tools for advanced analysis, best for those who trade on a high frequency.
Choosing the Right Plan
Your particular trading requirements will determine which one you choose. At $299.40 per year, the Essential plan is reasonable and accessible for more casual traders. Premium, at $599.40 per year, is ideal for power users.
The Ultimate plan is $5,999.40 per year, and it’s designed for professionals. Plus, new users can explore any plan risk-free with a free 30-day trial. Plus, they can get an extra $15 off by following the links provided in this article!
Benefits for Different Types of Traders
Day Traders and Scalpers
For day traders and scalpers who thrive on rapid-fire trades, TradingView equips you with tools that take the guesswork out of lightning-fast decision-making. The SuperCharts feature is one of the most impressive market research tools, enabling you to find trends and patterns like a hawk.
Heatmaps take this a step further by visually accentuating the most active sectors in the market, allowing you to quickly hone in on your best opportunities. For Forex traders, the Forex screener is worth its weight in gold. It automates the tedious process of scanning hundreds of currency pairs, saving you time, but more importantly, time keeps you laser-focused on the best possible setups.
Second-based alerts mean you’ll never miss a critical price movement, giving you the advantage when every millisecond counts.
Swing Traders and Investors
For longer time horizons, TradingView offers extensive charting tools to facilitate deeper analysis. Automatic chart patterns show you the optimal entry and exit levels.
On top, the platform supports for more than 1,350,000 instruments, making it possible to analyze almost any asset, wherever it’s located around the globe. You can take advantage of collaborative community features, in which other users contribute their own market predictions.
Fleshing out these concepts will sharpen your approach and expand your understanding of the market.
Beginners and Experienced Users
As you can see, TradingView is easy to use and open to traders of all experience levels. Beginners will benefit from the free plan or 30-day trial, giving them time to familiarize themselves with the software.
At the same time, expert traders will benefit from the pro-grade resources available, including advanced alerts and customizable charting. Even with the mobile app being not fully-featured, it still allows for quick updates and is very convenient on-the-go.
User Experience Insights
Interface and Usability
TradingView has a very modern and clean layout. This new design provides clear pathways for you to quickly locate the information you’re looking for without being overloaded. Whether you want to add new indicators to your charts, configure different timeframes, or add securities to your watchlist, the process is simple and intuitive.
The platform’s industry-leading charting tools are incredibly powerful and customizable, providing you with charting options that help even novice traders become experts. For the risk-takers out there, the Pine Script library is a gold mine, with more than 100,000 community-developed indicators. This helps to set the stage to test out more advanced strategies or to use automated tools if you’re going further into the weeds with technical analysis.
Mobile and Desktop Compatibility
With TradingView, you’ll enjoy smooth, seamless access on any device, easily switching between mobile and desktop without losing any power or capabilities. The mobile app is almost an exact replica of the desktop experience, so the transition to using it on a mobile device is seamless.
Whether you’re monitoring charts, working with alerts or keeping an eye on watchlists, do it all from mobile. This flexibility is perfect if you’re at your workstation or in transit, getting market updates while on the go. The platform’s tiered subscription—Essential, Plus and Premium—provides scalability, so you can upgrade to stay in sync with your developing trading demands.
Community Engagement Features
The default community-based elements are what makes TradingView special. You can follow other traders, share ideas, and even publish your own ideas. This unique, collaborative setting encourages active learning while creating space for networking and collaboration.
Some users do report unresponsiveness with customer support, which can be a frustrating experience if you run into problems. Even so, TradingView is still the go-to asset, thanks to its strong toolset and community-driven approach.
Comparison with Other Platforms
Unique Features of TradingView
TradingView’s biggest appeal is its vibrant, easy to navigate, and highly accessible platform, boasting 30 million users globally. That’s because their interactive web-based interface allows you to access charts and data from anywhere. This makes it different to MetaTrader platforms, which typically need to be downloaded.
TradingView has extensive coverage of all publicly traded financial markets. That opens up a much larger opportunity for you compared to other options such as thinkorswim, which only supports TD Ameritrade customers.
One of TradingView’s best features is its Pine Script language. You can import custom indicators and create custom strategies. That opens up a whole different level of customization that other platforms like Finviz or StockCharts can’t offer you.
Although Finviz is best-in-class at heatmaps and stock screeners, Finviz doesn’t have the firepower of TradingView’s scripting tools. TradingView connection to brokers is super smooth. That way you can click to place trades right from the charts, a feature that’s not available on some platforms such as StockCharts.
Strengths and Limitations
TradingView has immensely popular and powerful charting tools. It likely won’t offer the advanced analytics that platforms such as TrendSpider offer for swing trading or Finviz for deep data visualization.
MetaTrader 5 provides 21 timeframes, making it a shortcoming compared to TradingView’s capabilities. This is a disadvantage for high-frequency traders.
TradingView’s Elite tier is still a great value, cramming premium features for just $65/month without heavy upcharges.
Conclusion
Among those options, TradingView emerges as a powerful, all-in-one solution that caters to traders of all skill levels. Its charting tools, social features, and advanced analytics combined to bring clarity and depth to your trading decisions. No matter if you’re following stocks, forex, or crypto, the platform provides a plethora of tools that really cater to your needs. The various subscription tiers provide you with the most flexibility, allowing you to find something that’s right for your budget and trading style.
When you compare it with other platforms, TradingView really balances the advanced features with an easy-to-use interface. It demystifies complicated data and the seamless experience makes it easy whether you’re optimizing advanced strategies or collaborating with fellow traders.
So if you’re in the market for unique insights and next-generation tools, TradingView is the best choice. Dive into its capabilities, push it to its boundaries and discover how it can enhance your trading experience.
Frequently Asked Questions
What is TradingView?
TradingView is an ultra-powerful, cloud-based finance platform and social community for traders and investors. It provides powerful features to examine financial markets, including stock, forex, crypto, and many other trading activities.
Is TradingView free to use?
Additionally, yes, TradingView does offer a free plan with limited features, but for a more unparalleled trading experience, premium plans with advanced trading analysis capabilities are available through a subscription-based model.
What features does TradingView offer?
TradingView offers an unparalleled trading experience with real-time market data, customizable advanced charts, and a full range of technical analysis tools. Its social community allows traders to share valuable trade ideas and strategies.
Can beginners use TradingView?
It provides comprehensive tools and educational resources within a strong community, enhancing the trading experience for retail traders.
How does TradingView compare to other platforms?
What separates TradingView from the pack is its intuitive, easy-to-use interface, robust charting capabilities, and built-in social community. This financial platform offers an unparalleled trading experience, making it more visually oriented and user-friendly compared to most traditional trading platforms.
What are TradingView’s subscription costs?
TradingView provides an unparalleled trading experience with several plans: Free, Pro ($14.95/month), Pro+ ($29.95/month), and Premium ($59.95/month), catering to different trading needs.
Who benefits most from TradingView?
TradingView is perfect for any trader, whether you’re a beginner or a professional. Whether you’re a day trader, swing trader, or long-term investor, TradingView’s powerful technical analysis tools and market insights can help you make more informed trading decisions and refine your trading strategies.
Can you automate Tradingview to a MT5 broker?
Absolutelty that's where Pinetrader, a best in class Tradingview automation service comes in. We allow all kind of traders to code and automate their strategy.